
www.stateofthecoast.scot
www.stateofthecoast.scot
Average Temperatures – Aberdeen City
Annual Trends:
Fig. 1 demonstrates the average monthly maximum and minimum temperatures of Aberdeen City, comparing values from 1961-1990 to those of 1991-2020. Both the maximum and minimum of the modern period are greater than the previous period, suggesting the city has warmed over time. In further support of this warming trend, Fig. 2 shows continuous temperature data for Aberdeen over 50 years. The trendline displays a clear upwards trend, with a lot of variation inbetween. Overall, temperatures in the city have been increasing over the last half century:
Summer Trends:
Fig. 3 shows Aberdeen's annual summer temperatures over the last 50 years. Summer temperatures have not undergone as much of a change as the overall yearly average. These is a lot of variation in the pattern, with years of extremes such as 1996 and 1997. As of 2023, the average summer temperature sat at 14.4°C. For information about summer temperatures across Scotland, please see 'Summer Temperatures'.
Winter Trends:
Fig. 4 shows Aberdeen's annual winter temperatures over the last 50 years. These temperatures are much less variable than the summer temperatures and show a more consistently increasing trend. In the last 50 years, Aberdeen’s average winter temperature has increased by over 1°C: from 7.9°C in 1973, to 9.39°C in 2023. For information about winter temperatures across Scotland, please see 'Winter Temperatures'.
Scotland Wide Trends:
Fig. 5 shows Scotland’s overall average temperatures compared to Aberdeen's. While the Scotland-wide data set is on a shorter timescale, this comparison still offers valuable insight: it seems Aberdeen is of above average temperature for Scotland and is increasing in temperature faster than is typical for the country.
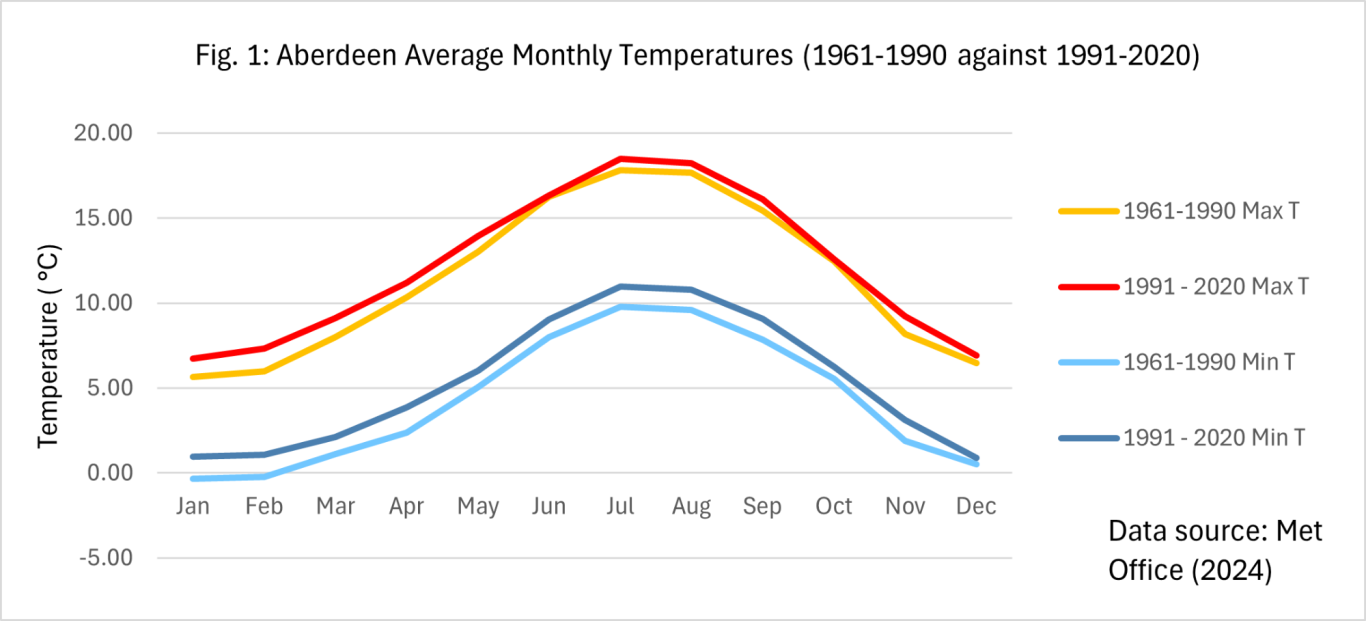
Figure 1: Average Monthly Max & Min Temperatures for (1961-1990) and (1991-2020) - Dyce, Aberdeen. Data Source: Met Office (2024)
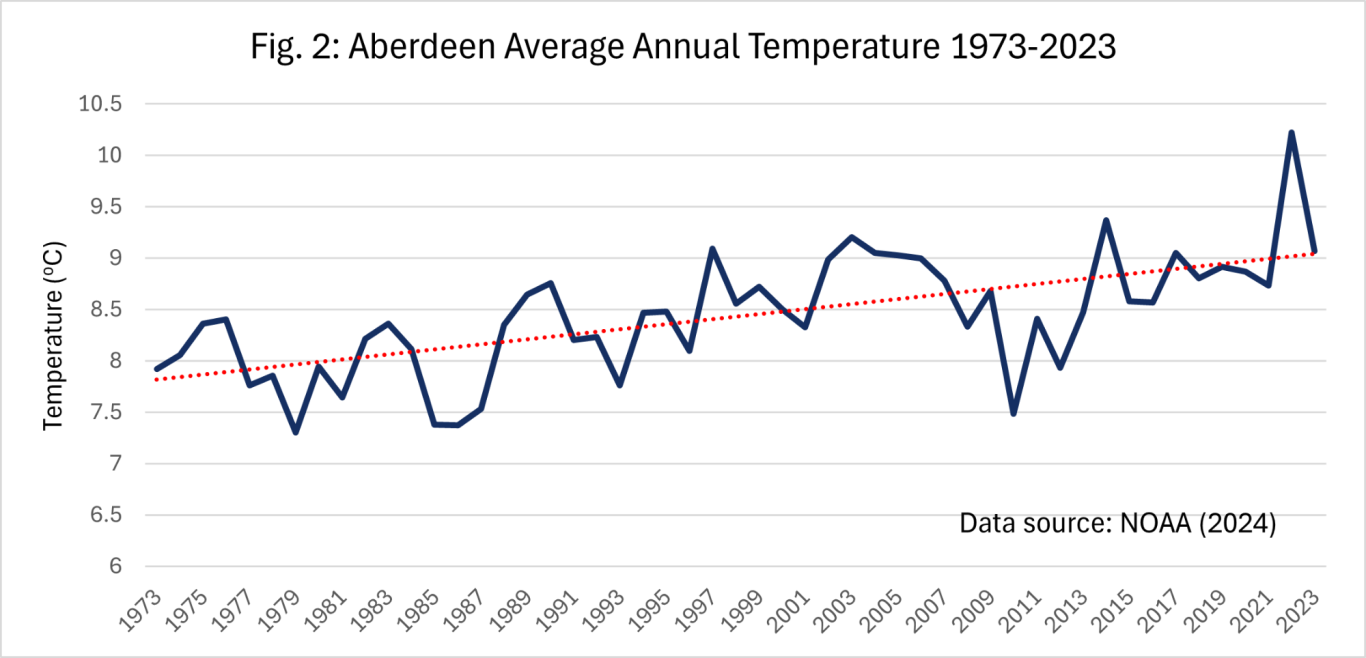
Figure 2: Average Annual Temperatures (1973-2023) – Craibstone, Aberdeen (NOAA, 2024)
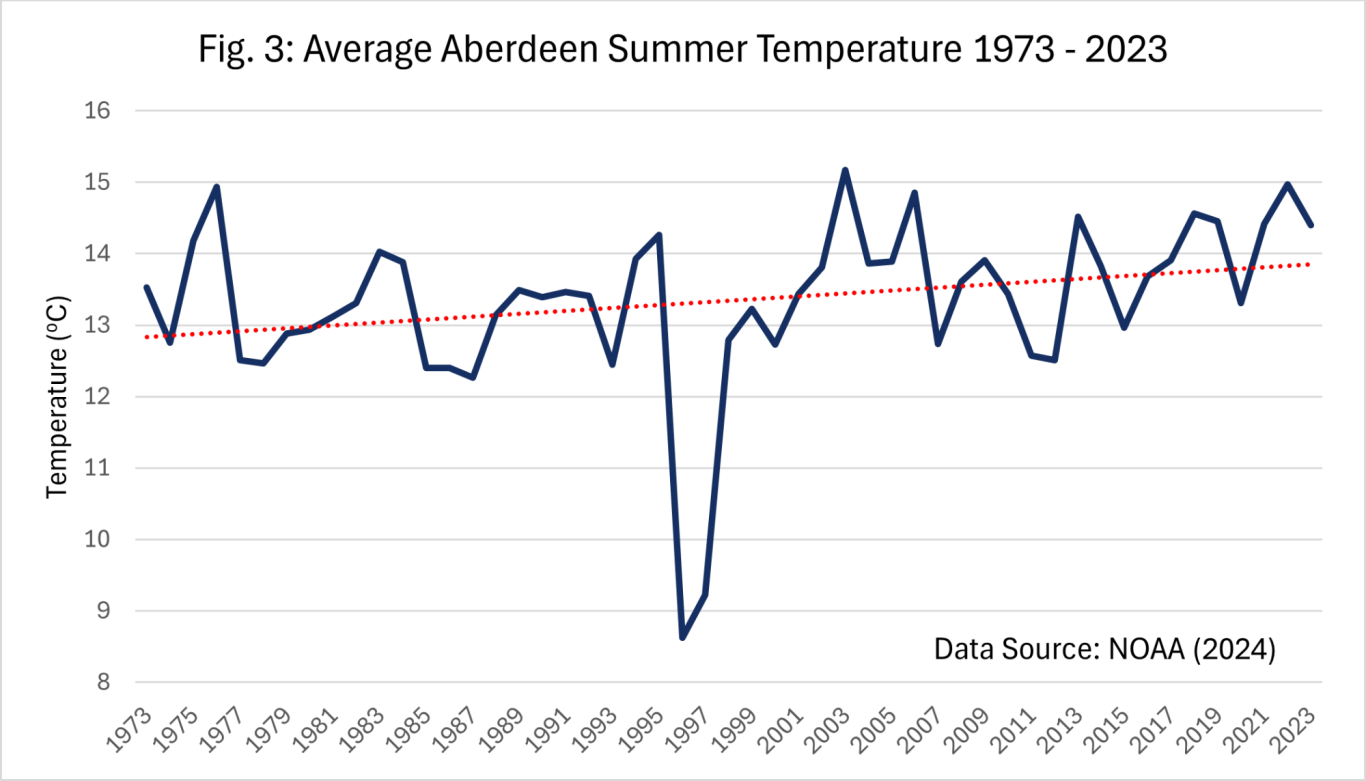
Figure 3: Average Summer Temperatures (Jun, Jul, Aug), (1973-2023) – Craibstone, Aberdeen. Data Source: NOAA (2024)
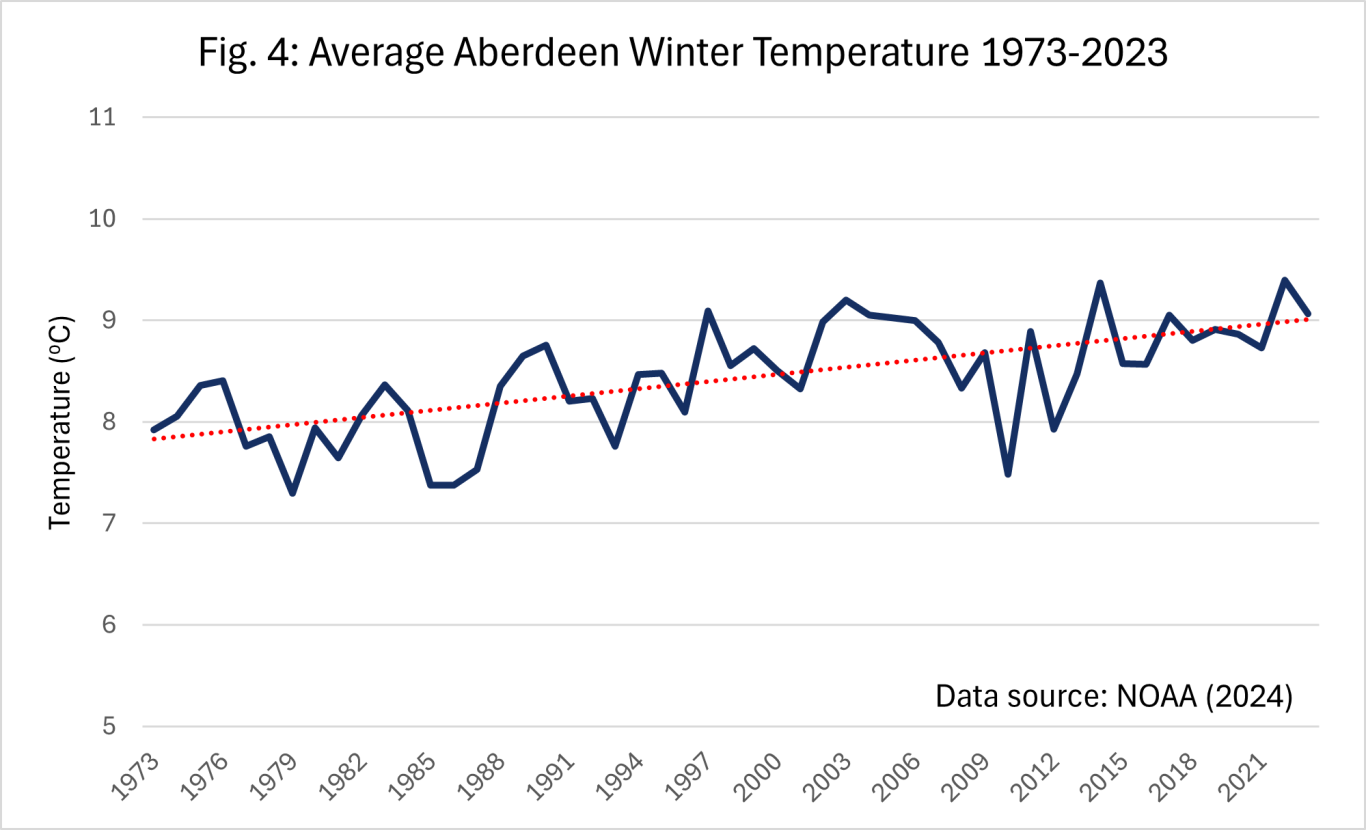
Figure 4: Average Winter Temperatures (Dec, Jan, Feb), (1973-2023) – Craibstone, Aberdeen. Data Source: NOAA (2024)
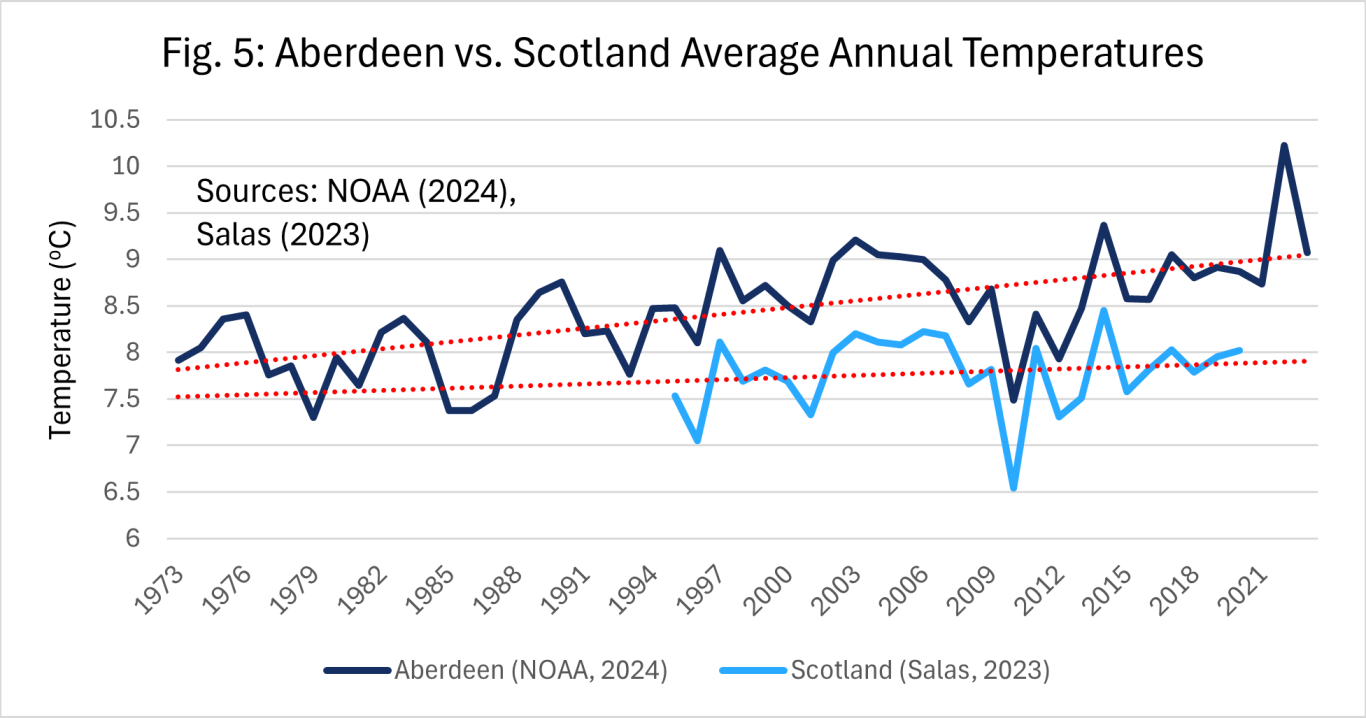
Figure 5: Scotland-wide average annual temperatures compared to Aberdeen. Scotland wide data set ranges from 1995-2020. Scotland Data Source: (Salas, 2023). Aberdeen Data Source: (NOAA, 2024).
It should be noted - data readings are taken from one location in Aberdeen, either Dyce (Met Office) or Craibstone (NOAA)
29/08/2024 by Cathryn Lovie
02/09/2024 by Ian Hay
20/12/2024 by Mariia Topol
06/03/2025 by Charlotte Tomlinson
Live - Next review due 06/03/2026
To report errors, highlight new data, or discuss alternative interpretations, please complete the form below and we will aim to respond to you within 28 days
Telephone: 07971149117
E-mail: ian.hay@stateofthecoast.scot

We need your consent to load the translations
We use a third-party service to translate the website content that may collect data about your activity. Please review the details in the privacy policy and accept the service to view the translations.