
East Grampian Coastal Partnership
www.stateofthecoast.scot
East Grampian Coastal Partnership
www.stateofthecoast.scot
Numbers of Cars per household has increased slightly between 2001 and 2022 on the East Grampian Coast while the number of households with no cars has decreased.
Compared with Scotland as a whole the East Grampian coast has more households with no or one car and less with 2 or more cars.
These figures have been taken from census records relating to selected coastal wards.
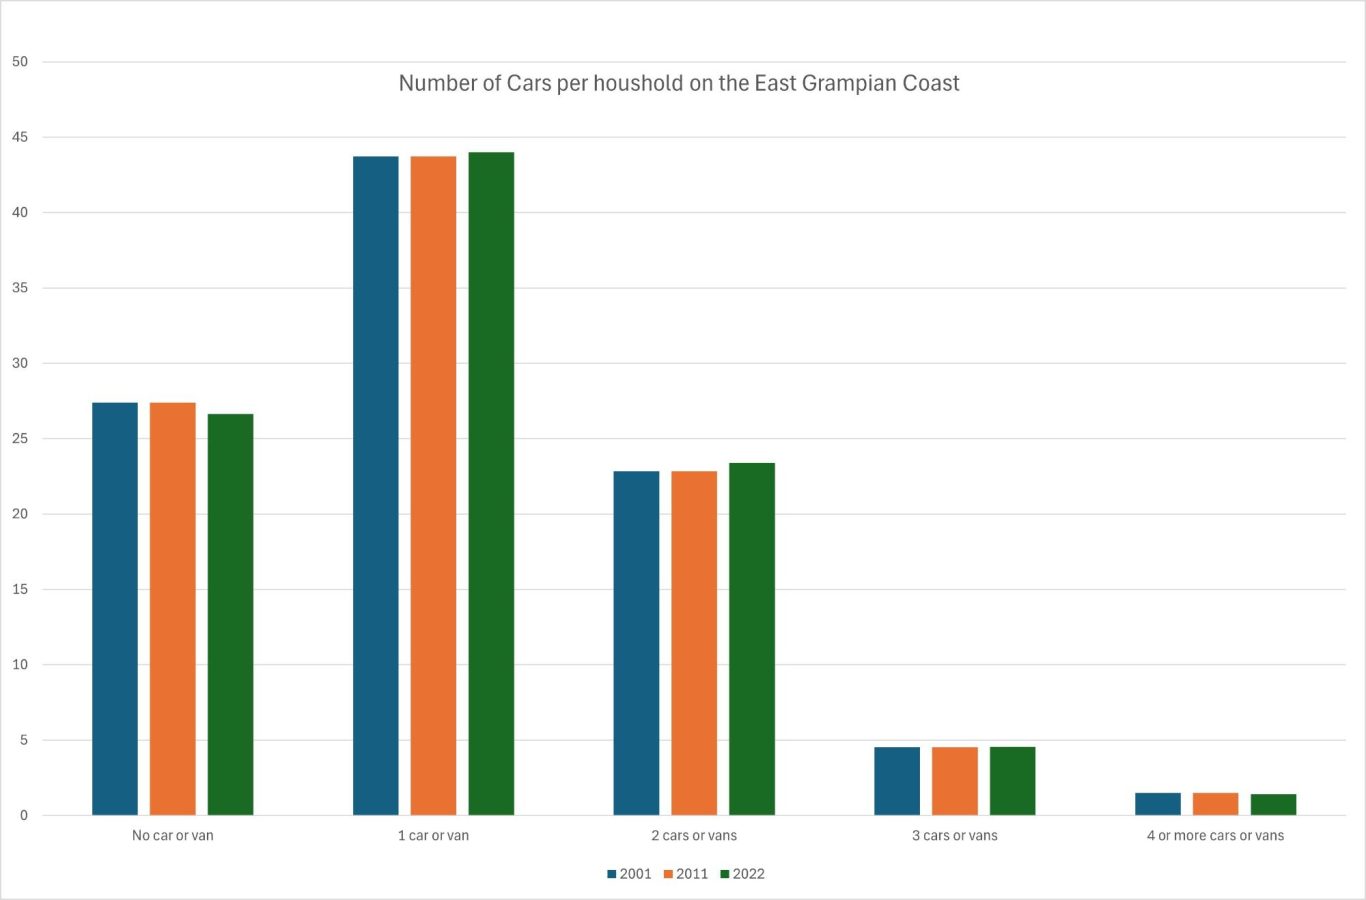
Figure 1: Number of cars per household on the East Grampian Coast (Census Data 2021,2011, 2022)
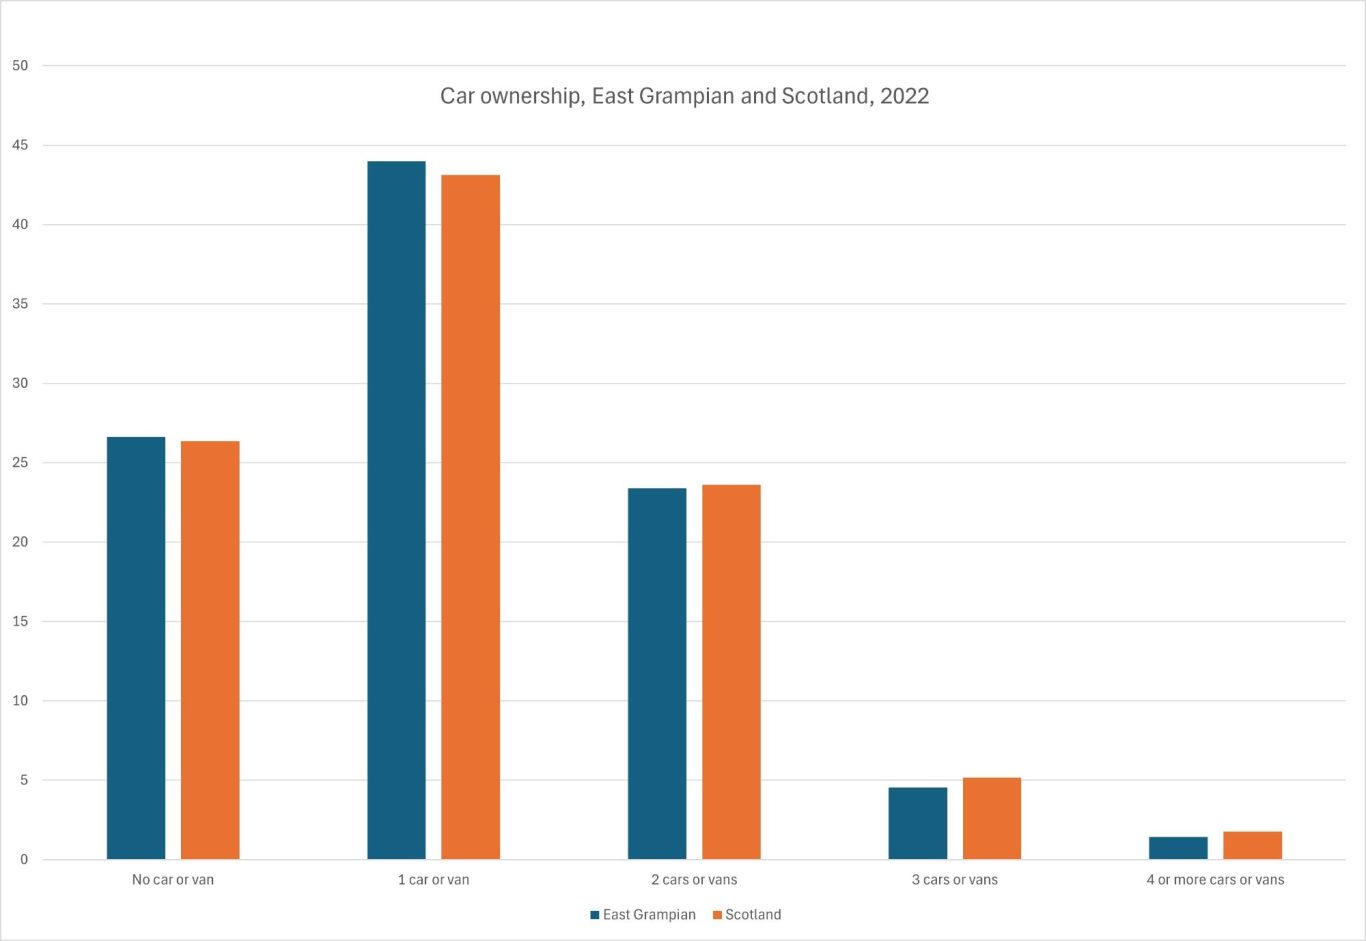
Figure 1: Number of cars per household on the East Grampian Coast and Scotland (Census Data 2022)
18/03/2025 by Ian Hay
Live - next update 18/03/2027
To report errors, highlight new data, or discuss alternative interpretations, please complete the form below and we will aim to respond to you within 28 days
Telephone: 07971149117
E-mail: ian.hay@stateofthecoast.scot
We need your consent to load the translations
We use a third-party service to translate the website content that may collect data about your activity. Please review the details in the privacy policy and accept the service to view the translations.